
")
Dear Elog friends !
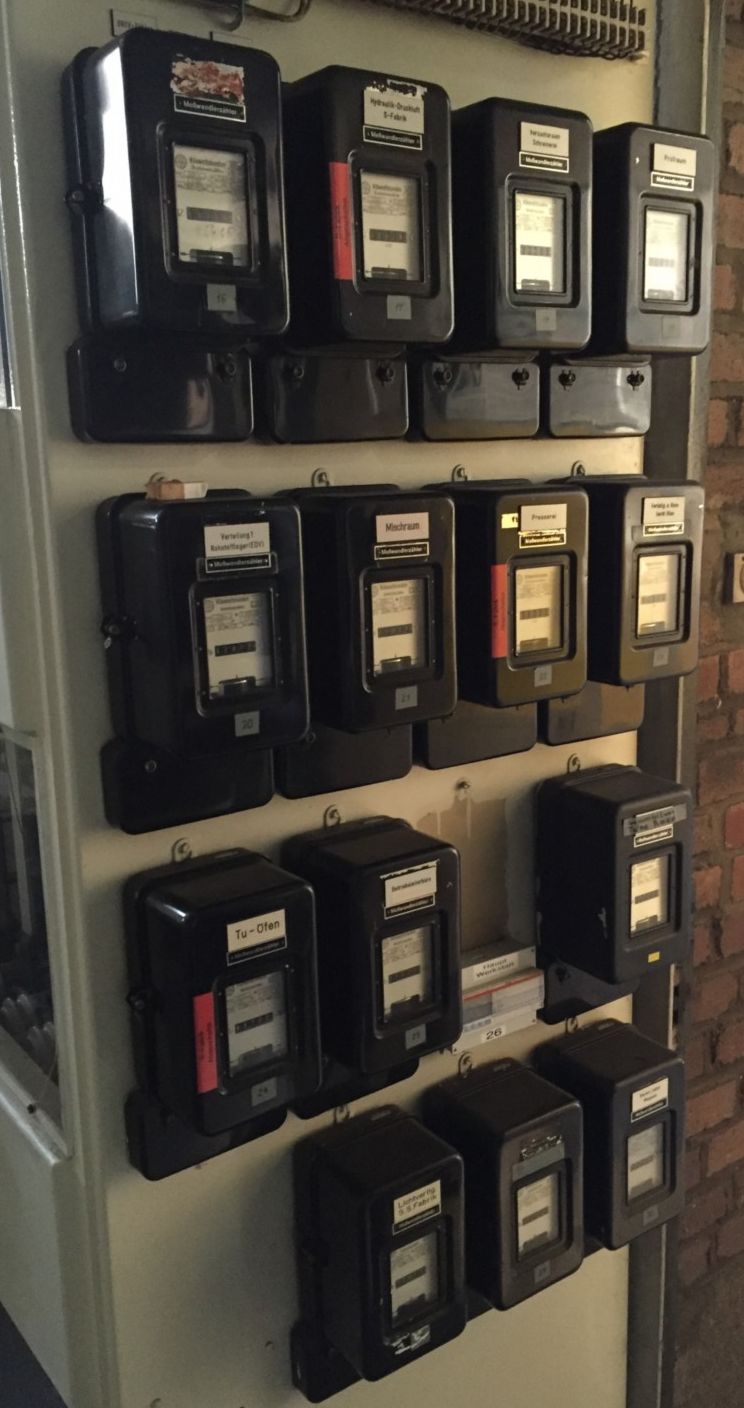
The state before digitalization with Elog!
Since publication of version 2 of Elog start 2018 we have invented many new features. These were based on operational experience and often on the suggestions of our customers.
In this news letter we summarize the most important innovations in the ELOG system.
Especially important:
ELOG Report is now listed at German Federal Office of Economics (BAFA) for use as ISO50001 Energie Management Software.
ELog Report Version 3 comes with smart innovations:
Database integration :
As an alternative to the previous storage of data as CSV files, storage in an SQL database is now possible. This allows queries to be handled even more flexibly.
It also makes data backup easier.
Excel/CSV Upload :
In addition to downloading Excel / CVS, data can now also be transferred from the user PC to the server, e.g. to integrate production data into the charts and directly determine key figures.
Optimized speed:
After a change in configuraion the system checks wich evaluation is affected. And only those are recalculated.
Flexibel time grid:
The time resolution of the aggregated data can be set separately. Minute (quarterly) hourly, daily or monthly recordings can be configured regardless of the total time of the result.
Aggregator cascading:
An aggregator can now be the source of another aggregator. This cascading means that an existing evaluation can be evaluated again according to further criteria.
Key Figures:
There is also the new aggregator function "Quotient"
If you store a file with production dates, e.g. the output against power consumption can be converted into a key figure.
Chart / permanent line:
Useful for analysis on how many days peak loads occurred.
Many usefull improvements to the interface :
-
Hide side menu
The side menu can now be folded away, which gives you much more screen space for the charts. A benefit also for the display on mobile devices.
-
Drag and Drop:
Menu elements can be moved freely using drag and drop. This allows the arrangement of the elements to be adjusted more quickly as desired. -
Copy items
The objects can now simply be copied. Copying is often faster than creating new ones. -
Keyboard Shortcuts:
nstead of using the mouse, many functions can be triggered by pressing a button. This speeds up the creation of new charts and tables. -
Report 2D Editor :
The reports can now be created by mouse interaction. Charts in the report can now be positioned, sized and adjusted interactively. -
Report text fields :
-
Multicharts :
New chart type with two Y axes right and left. For the common display of different types of measured values in a diagram e.g. Electricity and water consumption.
-
Tablet and mobile:
The display on mobile devices has become clearer. The options can be accessed via the "Hamburger Menu". -
Logos:
Optionally, the Elog header can be decorated with customer logos.
Alarms by mail:
If a measured value exceeds a limit value, an email alarm can be triggered. The user then receives precise information about which measuring point triggered the problem.
Report mailing:
Reports can now be sent regularly by email, e.g. can always be configured on the 2nd of a month.
Counter exchange
Previously there were jumps in the data tables when a counter was exchanged. This required manual rework. With automatic change detection, this is a thing of the past.
Remove old records:
After a minimum storage period has expired, old data is archived. This saves time and storage space on the server.
Support for other types of measuring devices
-
Devices with MODBUS TCP Interface e.g. Jumo
-
Devices with MQTT (Internet Of Things) e.g. Raspi based
REST Interface:
Would you like ELOG data integrate into other Scada systems ? The data can now also be called up using the HTTP REST protocol.
System basis:
The ELOG server is delivered in a proven manner as a fixed and finished virtual machine for Virtual Box or Hyper-V. The basis is a Bitnami LAMP stack currently with Debian 9 (Linux Core 4.9.) Instead of Ubuntu 14.04 (Linux core 3.13)
Last not Least. Stability:
We are constantly improving the product and new functions are added every week. In this way, ELOG always remains state of the art.
Ask Fränz & Jaeger if, how and when a new idea can be implemented.
You find a demo on our web site.
The documentation is available in the download section at www.fraenz-jaeger.de